LED calibration
The purpose of this procedure is to describe our method for calibrating LEDs for experiments with LPAs. We calibrate devices to produce the same photon flux across LEDs. We use two methods to calibrate LEDs depending on the type of LED configuration: an image analysis method for calibrating LEDs of the same wavelength (e.g. twenty-four 647 nm LEDs), and a probe spectrometer method for calibrating LEDs of different wavelength (e.g. action spectrum LED sets). Before calibration, it is critical that LEDs be firmly pushed down into their sockets to ensure proper LED height and alignment. For both methods the device is assembled from the mounting plate up to the circuit board-spacer module. During calibration only one channel, i.e. only one LED per well, can should be on at a time.
LED compensation is achieved by setting the grayscale and dot correction for each LED. These values are distinct from the intensity values set in Iris. Grayscale and dot correction values are stored on the device’s SD card as files “gcal.txt” and “dc.txt”, respectively, and must be space delimited integers from 0-255 and 0-63, respectively. Coarse adjustments can be made by setting the LED dot correction, while fine adjustments can be made setting the gray scale value.
Note that the grayscale adjustment reduces the resolution of intensities which can be achieved. With a maximum grayscale adjustment value of 255, there are 4096 intensity levels which can be programmed. However, the number of intensity levels available reduces proportionally to the grayscale adjustment value. For example, if the grayscale adjustment value is set to 100, there will only be 4096 * 100/255 = 1606 programmable intensity levels. This reduction in resolution means that when programming values in Iris, multiple programmed values will correspond to the same resulting intensity. Continuing the example, a programmed value of 4095 will be converted to 1606 internally in the LPA, while the programmed values of 4095, 40945, and 4093 will all correspond to 1605.
Image analysis method:
We developed an image analysis method for calibrating LEDs of the same wavelength to one another. The method is relatively fast and utilizes a MATLAB script (Supplementary Files) which analyzes pixel intensity of images taken top-down of the device while all LEDs in a channel (top row or bottom row) are set to a constant intensity. We had success taking top-down images of devices in an enclosed gel-imager (FluorChem FC2, Alpha Innotech) which blocks out ambient light. Briefly, we set all LEDs within a channel to a single Iris intensity below the saturation threshold (but ≥ 100, see above) of the gel imager camera. To reduce the spatial structure of the LED light we place three sheets of diffuser paper (#3008, Rosco) atop the LED spacer and add the plate adapter. The device is centered below the camera and powered on. Finally, images (60ms exposure) are taken at 0° (well 1 in top corner) and at 180° (well 1 in bottom right, i.e. transposed). Images are then analyzed by the MATLAB script. A README HowTo which contains details of running the script as well as example images and script outputs is available in the image analysis Supporting FileSupplementary Files. After calibration by image analysis, photon flux is determined by measuring a subset (≥ five LEDs) of the calibrated LEDs with a probe spectrometer (see below).
LED outputs before and after image analysis calibration
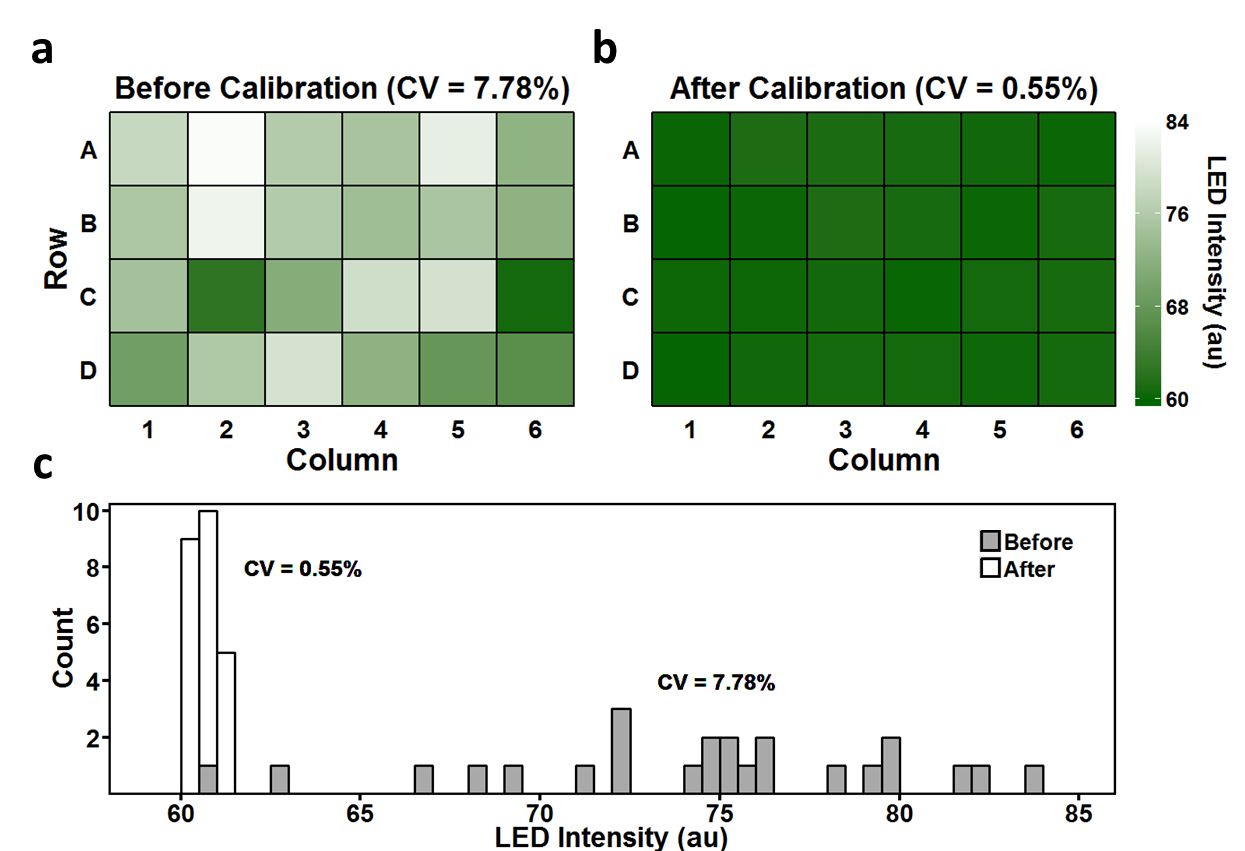
Representative comparison of LED intensity output before and after the image analysis calibration procedure (see Supplementary Method on LED calibration). (a) Heatmap showing distribution of 678 nm LED intensities prior to calibration (CV = 7.78%). (b) Heatmap showing intensity distribution of the same LEDs as in (a), after the image analysis calibration (CV = 0.55%), in which LEDs are scaled to the dimmest LED. (c) Histogram of LED intensity outputs from (a) and (b). LED intensities are measured as the sum of pixel intensity inside the LPA well containing the LED.
Probe spectrometer method:
The image analysis method does not work for calibrating LEDs of different wavelength to each other due to the camera’s differential sensitivity to different wavelengths of light. For action spectra LED configurations, we directly measure the photon flux of each LED using a probe spectrometer (StellarNet Inc, photodetector: EPP2000 UVN-SR-25LT-16, probe: F600-UV-VIS-SR, software: SpectraWiz) ((Supplementary Fig. S20), (SpectraWiz Software) and 3D printed probe adapter (Supplementary Fig. S7b). The probe adapter is designed to align the probe directly above an LED within a well at the same height as the bottom of the cell culture plate*. During calibration, the device is programmed with a constant, sub-saturating intensity (usually between 10-20μmol m-2 s-1) across each LED being calibrated. A typical probe calibration workflow is as follows:
- Coarse adjust LED output to the approximate desired intensity by measuring photon flux while adjusting dot correction. Do this one LED at a time.
- Measure photon flux for all LEDs. The measurement can be performed using the peak-fitting function within SpectraWiz, or can be made by saving the spectrum and calculating the integral of the peak from the spectral flux data.
- Calculate:
GS_desired = Intensity_desired/Intensity_current GS_current
and enter the desired gray scale values for each LED.
- Repeat steps 2-3 until desired photon flux and variance across LEDs is achieved.
Photograph of light intensity probe measurement setup.
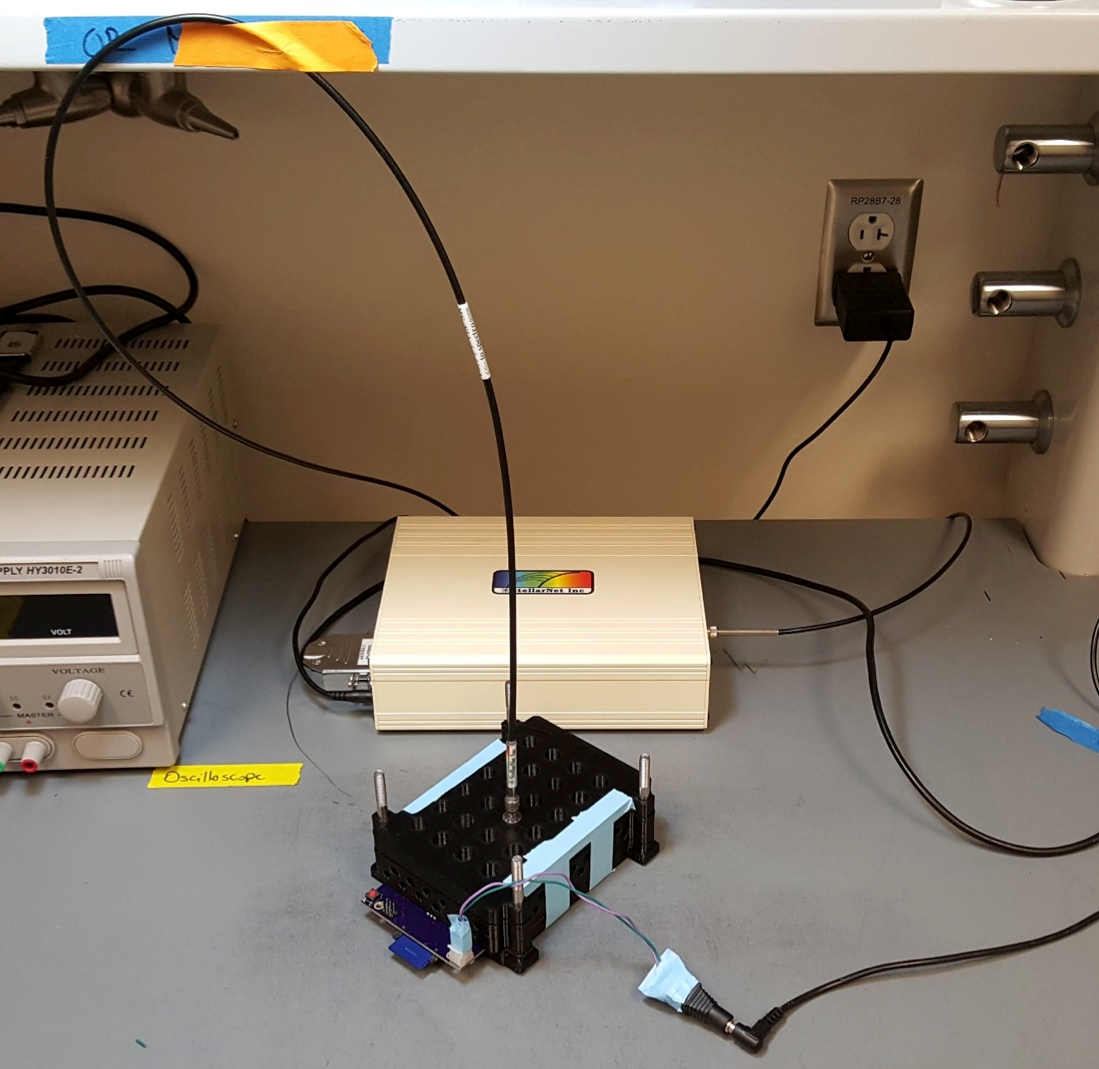
An example of the setup used to make LED intensity measurements with the probe spectrometer is shown. The LPA is assembled from the mounting plate to LED spacer & gasket and the probe adapter is installed as the top layer. Tape is used to compress layers together. The probe fits snuggly within the probe-LED alignment holes and is positioned directly above the LED being measured. Instructions for measurements and calibration with the probe spectrometer can be found in the Supplementary Method on LED calibration.